Analyzing Microsoft Corp (MSFT): A Comprehensive Financial Review
An in-depth examination of historical income statements, balance sheet growth, and operational cash flows based on verified corporate filings.

Introduction to Microsoft Corp and Business Profile
Microsoft Corp, trading under the ticker symbol MSFT on the NASDAQ exchange, operates within the prepackaged software industry under the standard industrial classification code 7372. As a major component of the technology sector, the company has historically maintained a central role in enterprise software, cloud computing, and productivity solutions. This analysis examines the financial trajectory of Microsoft Corp based on verified corporate data as of August 2026, offering retail investors an unvarnished look at the underlying metrics.
Understanding a company of this scale requires looking beyond surface-level market sentiment and focusing on fundamental accounting data. By reviewing annual reports spanning multiple fiscal years up to June 30, 2023, market participants can evaluate how revenue generation, cost management, and capital allocation have evolved over time. This report outlines key financial categories without relying on speculative projections or unsupported growth assumptions.
Top-Line Revenue and Gross Margin Performance
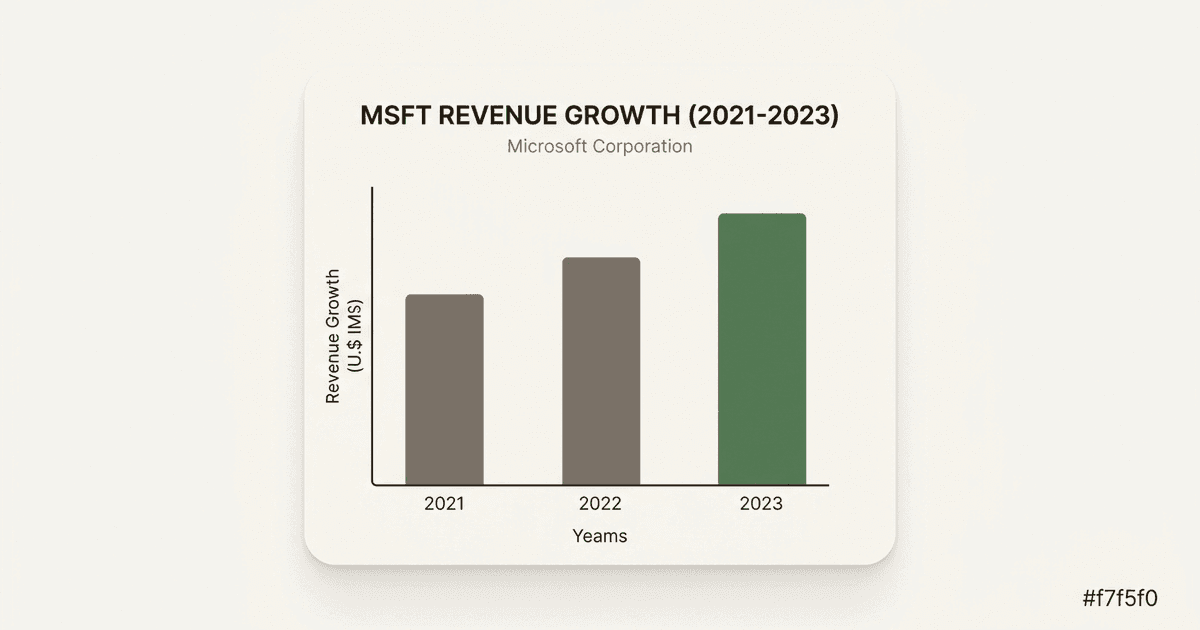
An examination of Microsoft Corp's income statement reveals steady top-line expansion across the analyzed fiscal periods. For the fiscal year ending June 30, 2021, reported revenue stood at $168.09B. This figure increased to $198.27B for the period ending June 30, 2022, and reached $211.92B by June 30, 2023. This steady upward movement reflects sustained demand across the company's core operating segments.
Alongside revenue growth, cost of revenue also expanded, moving from $52.23B in 2021 to $62.65B in 2022, and reaching $65.86B by 2023. Despite rising direct costs, gross margin figures demonstrated consistent dollar-value growth over the same timeframe. Gross margin was recorded at $115.86B for 2021, climbing to $135.62B in 2022, and reaching $146.05B by the close of fiscal year 2023. These figures highlight the scale of operations managed by the firm.
Operating Expenses and Income Generation
Operating expenses at Microsoft Corp encompass investments in research and development, sales and marketing, and general and administrative functions. Research and development expenditures grew from $20.72B in fiscal 2021 to $24.51B in fiscal 2022, and further to $27.20B by fiscal 2023. Similarly, sales and marketing costs moved from $20.12B in 2021 to $21.83B in 2022, and $22.76B in 2023. General and administrative expenses were recorded at $5.11B, $5.90B, and $7.58B across the respective three fiscal years.
When accounting for these operational expenditures, operating income showed a positive trajectory. Operating income stood at $69.92B for the period ending June 30, 2021, rising to $83.38B by June 30, 2022, and totaling $88.52B for the period ending June 30, 2023. Net income figures followed a related pattern, starting at $61.27B in 2021, peaking at $72.74B in 2022, and registering at $72.36B for the fiscal year ending June 30, 2023.
Balance Sheet Strength and Asset Composition
The balance sheet provides insight into the capitalization and liquidity reserves of Microsoft Corp. Total assets expanded over the reviewed period, moving from $333.78B as of June 30, 2021, to $364.84B in 2022, and reaching $411.98B by June 30, 2023. Total current assets remained relatively stable at $184.41B in 2021, $169.68B in 2022, and $184.26B in 2023.
Liquidity management is evident through cash, cash equivalents, and short-term investments. Total cash, cash equivalents, and short-term investments were recorded at $130.33B in 2021, $104.76B in 2022, and $111.26B as of June 30, 2023. On the liability side, total liabilities stood at $191.79B in 2021, $198.30B in 2022, and $205.75B in 2023, resulting in total stockholders' equity of $141.99B, $166.54B, and $206.22B across the three respective periods.
Cash Flow Dynamics and Capital Allocation
An analysis of cash flow statements details how cash is generated and deployed across business activities. Net cash from operations was reported at $76.74B for the fiscal year ending June 30, 2021, $89.04B for 2022, and $87.58B for the period ending June 30, 2023. These operational inflows support ongoing capital expenditures and shareholder return programs.
Investing activities included significant additions to property and equipment, which amounted to $20.62B in 2021, $23.89B in 2022, and $28.11B in 2023. Financing activities reflected substantial cash deployment toward equity management and dividends. Common stock repurchased totaled $27.39B in 2021, $32.70B in 2022, and $22.25B in 2023. Additionally, common stock cash dividends paid were $16.52B, $18.14B, and $19.80B across the three respective fiscal years, demonstrating consistent capital return to equity holders.
Key takeaways
- Revenue grew from $168.09B in fiscal 2021 to $211.92B in fiscal 2023.
- Operating income expanded from $69.92B in 2021 to $88.52B in 2023.
- Total assets increased from $333.78B to $411.98B over the same three-year span.
- Net cash from operations remained robust, recording $87.58B for the period ending June 30, 2023.
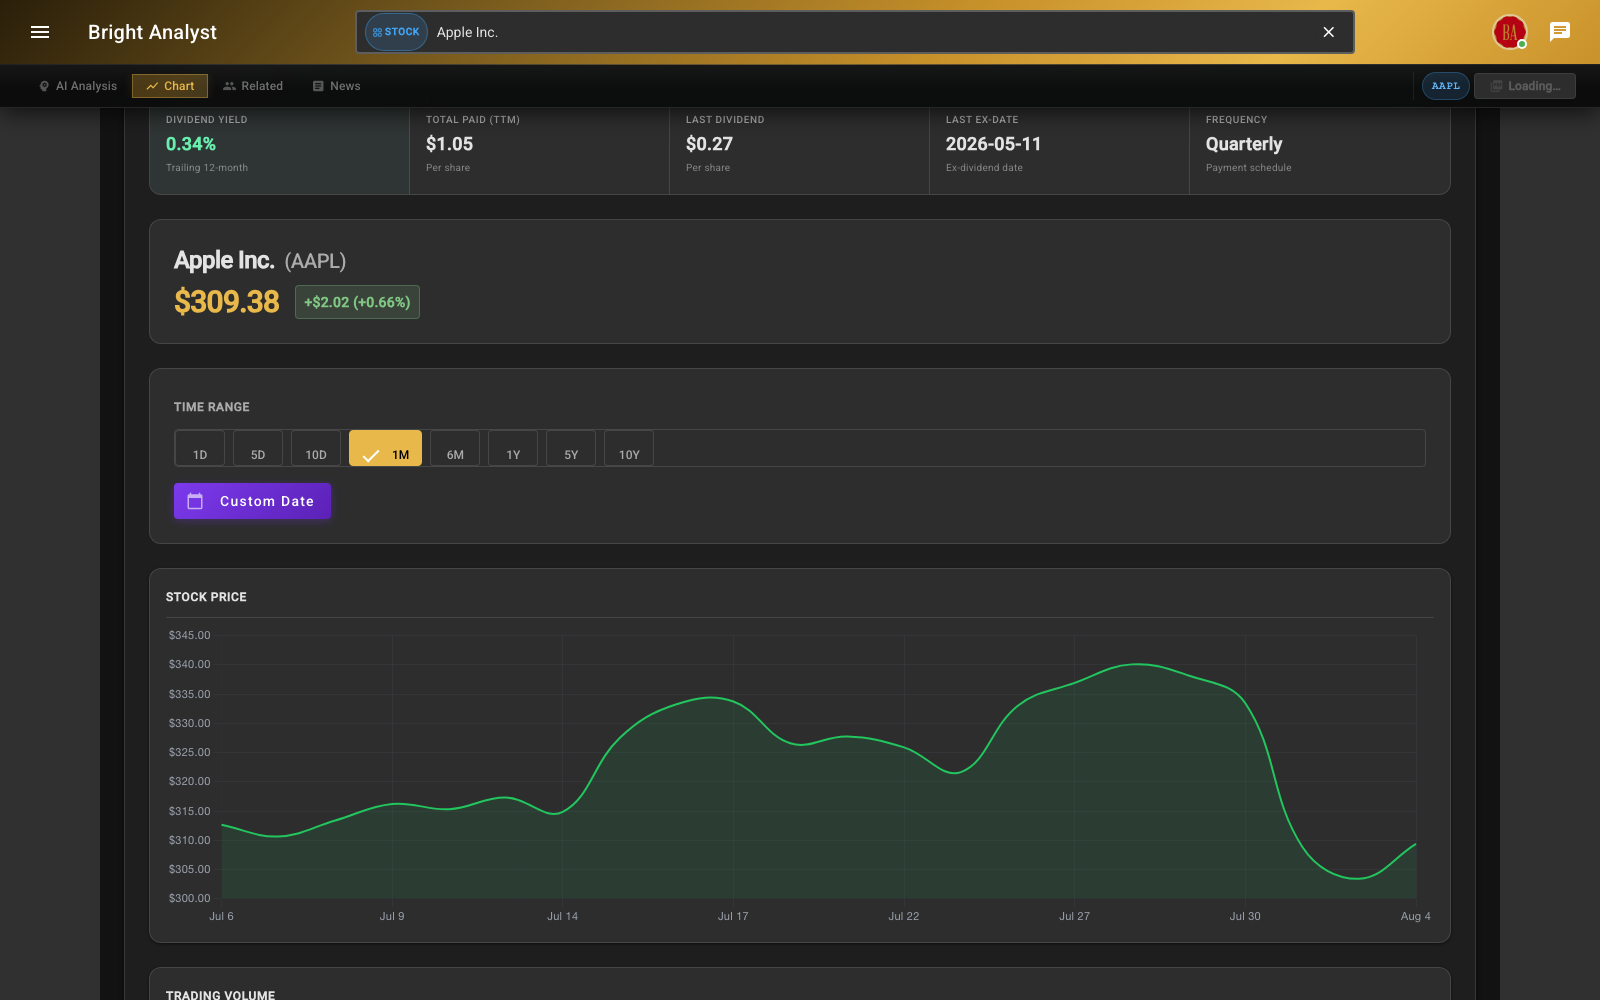
Interactive price charts with dividends, splits, and technicals built in.
See the live analysis on Bright Analyst →
This content is for informational purposes only and does not constitute investment advice. Past performance is not indicative of future results.
Responses (3)
Great Analysis
Yaa right
Great Analysis 2
Good analysis