A Financial Examination of Tesla, Inc. Ticker TSLA
Analyzing recent multi-year financial statements, market performance metrics, and risk characteristics for Tesla, Inc.

Introduction to Tesla, Inc. and Market Standing
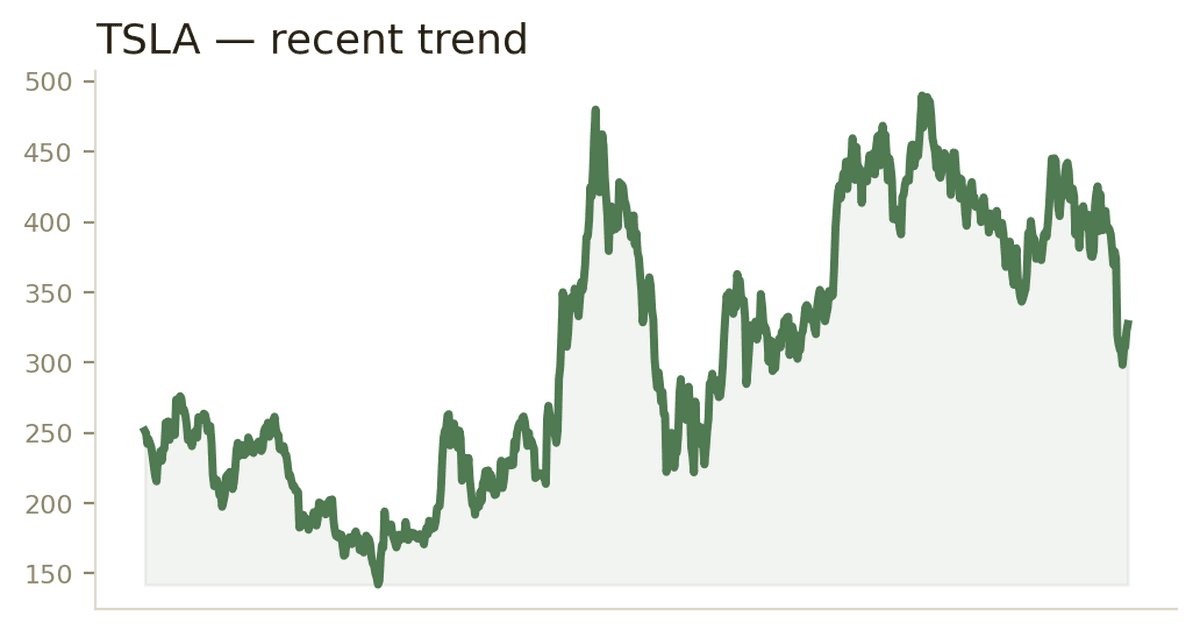
Tesla, Inc. operating under the ticker TSLA and registered under CIK 1318605 within the motor vehicles and passenger car bodies industry under SIC 3711, trades on The Nasdaq Global Select Market. As of the latest available reporting data, the company's last recorded price stands at 327.35. Assessing equity performance over various time horizons reveals a 1-day change of 1.64 percent, a year-to-date change of -27.21 percent, and a 1-year change of 5.85 percent. Looking at broader historical horizons, the 3-year compound annual growth rate rests at 8.84 percent, while the 5-year compound annual growth rate is recorded at 6.68 percent.
Market participants tracking high and low ranges note that the 52-week high reached 498.83 and the 52-week low touched 297.38. This places the current equity price at -34.38 percent off its 52-week high. Additionally, external market intelligence profiles indicate a market capitalization of $1,292.88B. Reviewing these price points establishes a contextual baseline for examining the underlying financial statements and structural operational performance over recent annual periods.

Income Statement Trends and Revenue Evolution
A detailed review of Tesla, Inc.'s income statement figures across recent annual reporting periods ending December 31 provides insight into revenue generation and cost structures. For the period ending December 31, 2024, total revenues reached $97.69B, showing a steady progression from the $96.73B reported for the period ending December 31, 2023. Earlier historical periods show total revenues of $81.46B for 2022 and $53.82B for 2021.
Cost management metrics reflect similar scale. Total cost of revenues was recorded at $80.24B for 2024, compared to $79.11B in 2023, $60.61B in 2022, and $40.22B in 2021. Consequently, gross profit figures registered at $17.45B for 2024, $17.66B for 2023, $20.85B for 2022, and $13.61B for 2021. Operating expenses also grew, with total operating expenses moving from $7.08B in 2021 to $7.20B in 2022, $8.77B in 2023, and reaching $10.37B in 2024. Within operating expenses, research and development spending increased systematically, moving from $2.59B in 2021 to $3.08B in 2022, $3.97B in 2023, and $4.54B in 2024.
Income from operations stood at $6.52B in 2021, expanding to $13.66B in 2022, before moderating to $8.89B in 2023 and $7.08B in 2024. Net income attributable to common stockholders followed a similar trajectory, registering at $5.52B in 2021, peaking at $12.56B in 2022 and $15.00B in 2023, and subsequently recording $7.09B in the period ending December 31, 2024. Basic net income per share of common stock was reported at 5.60 for 2021, 4.02 for 2022, 4.73 for 2023, and 2.23 for 2024.

Balance Sheet Structure and Asset Composition
Examining the balance sheet of Tesla, Inc. highlights the structural expansion of assets, liabilities, and equity over the comparative annual cycles. Total assets grew from $62.13B at the end of 2021 to $82.34B in 2022, $106.62B in 2023, and $122.07B as of December 31, 2024. Current assets experienced parallel growth, moving from $27.10B in 2021 to $40.92B in 2022, $49.62B in 2023, and $58.36B in 2024.
Cash and cash equivalents remained robust across periods, registering $17.58B in 2021, $16.25B in 2022, $16.40B in 2023, and $16.14B in 2024. Short-term investments expanded significantly from $5.93B in 2022 to $12.70B in 2023 and $20.42B in 2024. Inventory levels were recorded at $5.76B in 2021, rising to $12.84B in 2022, $13.63B in 2023, and shifting slightly to $12.02B in 2024. Property, plant, and equipment, net, demonstrated continuous capital deployment, expanding from $18.88B in 2021 to $23.55B in 2022, $29.73B in 2023, and $35.84B in 2024.
On the liabilities side, total liabilities increased from $30.55B in 2021 to $36.44B in 2022, $43.01B in 2023, and $48.39B in 2024. Total current liabilities moved from $19.71B in 2021 to $26.71B in 2022, $28.75B in 2023, and $28.82B in 2024. Total stockholders' equity strengthened notably over the same intervals, growing from $30.19B in 2021 to $44.70B in 2022, $62.63B in 2023, and $72.91B at the close of 2024.

Cash Flow Analysis and Capital Allocation
Operating cash flow provides an indicator of the core cash-generating capabilities of the enterprise. For the periods analyzed, net cash provided by operating activities was reported at $11.50B in 2021, $14.72B in 2022, $13.26B in 2023, and $14.92B in 2024. Adjustments for non-cash expenses such as depreciation, amortization, and impairment contributed significantly to these figures, recording $2.91B in 2021, $3.75B in 2022, $4.67B in 2023, and $5.37B in 2024. Stock-based compensation was noted at $2.12B in 2021, $1.56B in 2022, $1.81B in 2023, and $2.00B in 2024.
Investing activities primarily reflected capital expenditures directed toward infrastructure and asset expansion. Purchases of property and equipment excluding finance leases, net of sales, required substantial outlays: $6.48B in 2021, $7.16B in 2022, $8.90B in 2023, and $11.34B in 2024. Net cash used in investing activities totaled $7.87B in 2021, $11.97B in 2022, $15.58B in 2023, and $18.79B in 2024. Financing activities reflected various capital structure adjustments, with net cash provided by (or used in) financing activities recording -$5.20B in 2021, -$3.53B in 2022, $2.59B in 2023, and $3.85B in 2024.
Risk Profile and Volatility Metrics
An evaluation of risk metrics relative to the benchmark ticker SPY highlights the distinct volatility profile associated with TSLA. Based on historical data series, the annualized return for TSLA sits at 7.04 percent, compared to the benchmark annualized return of 13.29 percent. However, annualized volatility for TSLA is recorded at 60.24 percent, notably higher than the benchmark volatility of 15.76 percent.
Risk-adjusted performance indicators show a Sharpe ratio of 0.12 for TSLA and 0.84 for the benchmark. The Sortino ratio registers at 0.20 for TSLA and 1.40 for the benchmark. Beta, which measures sensitivity to market movements, stands at 1.82, while alpha is recorded at -0.17. The maximum drawdown observed in the risk dataset reaches -73.63 percent, corresponding to a specific drawdown period spanning from November 5, 2021, to January 3, 2023, with a length of 424 days and a recovery period of 708 days. Additional risk metrics include a value at risk (VaR 95) of -5.77 percent, a downside deviation of 0.35, and a positive months percentage of 50.82 percent.
Dividend Policy Overview
A review of capital return policies indicates that Tesla, Inc. maintains a zero-dividend stance. According to raw dividend data provided, the dividend yield TTM (trailing twelve months) is 0.0 percent, with total dividends paid TTM amounting to 0.0. Furthermore, dividend frequency is classified as none, and the last dividend amount and date are listed as null. This reflects a corporate strategy centered around reinvesting capital into research, development, and operational scaling rather than distributing regular cash dividends to common stockholders.
Key takeaways
- Tesla, Inc. trades on The Nasdaq Global Select Market under the ticker TSLA, with a last reported price of 327.35 as of the latest data.
- Total revenues reached $97.69B for the annual period ending December 31, 2024, compared to $96.73B for 2023.
- Net cash provided by operating activities was reported at $14.92B for 2024, supporting ongoing capital expenditures.
- Annualized volatility stands at 60.24 percent with a beta of 1.82 relative to the benchmark ticker SPY.
- The company maintains a zero-dividend policy with a dividend yield TTM of 0.0 percent.
Interactive price charts with dividends, splits, and technicals built in.
See the live analysis on Bright Analyst →
This content is for informational purposes only and does not constitute investment advice. Past performance is not indicative of future results.
TSLA price history — Source: Bright Analyst, as of Oct 10, 2026
BRIGHT ANALYSTTSLA — largest historical drawdowns — Source: Bright Analyst, as of Oct 10, 2026
BRIGHT ANALYSTTSLA vs. SPY — hypothetical $100k — Source: Bright Analyst, as of Oct 10, 2026
BRIGHT ANALYST